Debugging
Studio is being deprecated, please head over to the documentation page for Mattercraft, our most advanced 3D tool for the web, where you can find the most recent information and tutorials.
ZapWorks Studio comes paired with a desktop version of the Zappar app so you can test your zaps on your development machine.
As well as being able to preview zaps without the need for a device, the desktop Zappar app provides access to the JavaScript developer tools for debugging.
Launching Desktop Zappar App
Section titled “Launching Desktop Zappar App”The desktop app can be launched from the preview window of ZapWorks Studio by selecting ‘Launch in Zappar for x’ (x being your operating system) after the preview has loaded.
This will open the Zappar app and automatically load the experience previewed.
Your computer must have a webcam attached and accessible for the desktop app to work.
JavaScript Console
Section titled “JavaScript Console”As well as a refresh button in the top right corner that allows you to scan a new code, there is a settings button that opens the developer tools.
The Console tab of the developer tools is where logged messages will appear as well as any error and system messages.
Messages can be logged to the console by using the console.log(...) function from within a Script node.
For example, a message could be output when the show event is called on the root node by calling the console.log(...) function in the provided show Script node.
var display_shown = symbol.controllers.display.elements.shown;var display_hidden = symbol.controllers.display.elements.hidden;
parent.on("show", parent_show);function parent_show() {
    // Make sure we start from fully hidden    display_hidden.reset();
    // Move to the shown state    display_shown.activate();
    // The Console log message    console.log("This is a console log message on show");}
Now when running the preview in the desktop app, navigating to the console should show the log message output.
Variables can also be logged to the console to check their values at different points in code which is a helpful tool for debugging unexpected behaviour.
The example below shows a number variable being logged to the console before and after its value is changed.
// Setting up a variablevar myNumber = 0;
// The console will show '0'console.log(myNumber);
// Changing the value of the variablemyNumber = 5;
// Further down the console will show '5'console.log(myNumber);
Advanced Debugging
Section titled “Advanced Debugging”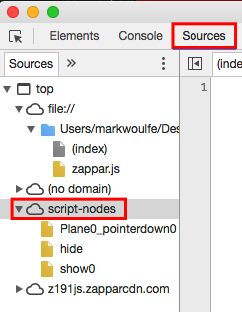
Script Nodes
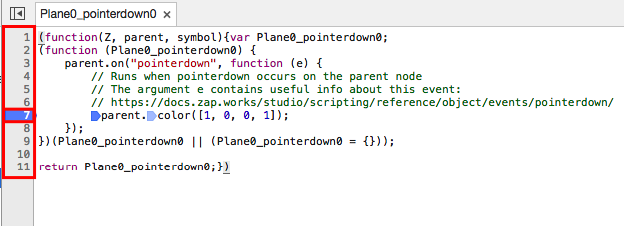
The Sources tab of the developer tools allows you to see a list of the script nodes in your project under the script-nodes dropdown on the left. Clicking on a script node will show you the code within it. Note that the code shown differs a little from the original script code (it’s been converted into true JavaScript) but should be readable.
Breakpoints
You can add breakpoints within the script window by clicking the numbers next to lines of code. A breakpoint is an intentional pause in a program; when Zappar is running your script it will stop at breakpoints and provide a number of useful debugging tools. At the top right of the window there are buttons for:
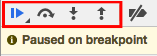
- Resuming script execution
- Stepping over the next function call
- Stepping into the next function call
- Stepping out of the current function
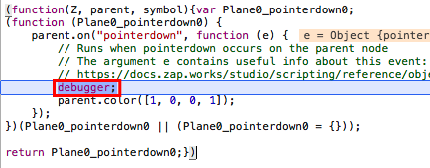
You can automatically add a breakpoint in a script node by using the following code:
debugger;
You still need to have the developer tools open when using scripted breakpoints in order to pause the program.
Exceptions
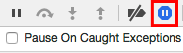
As well as breakpoints, you can set the program to pause when an exception is thrown by clicking the button in the top right of the window. ‘Exception’ is a technical term given to an error thrown by the program.
Scope
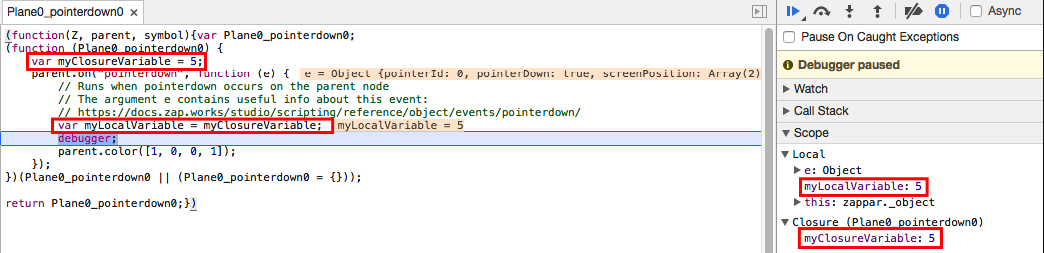
The Scope pane can be used to view and edit the values of properties and variables. In Zappar the two scopes used are local and closure:
- Local - A variable declared within the current function block.
- Closure - A variable declared outside the current function block, but referenced within the current function block.
Watching Variables
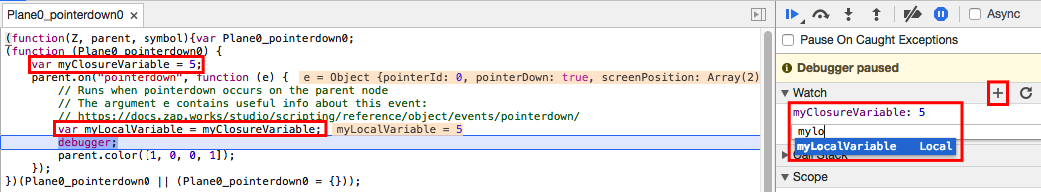
Local and closure variables can be added to the Watch pane in order to monitor their value as the program executes, helpful for when you have a large number of variables within a script but are trying to concentrate on a specific set.
A variable can be added to the Watch pane by clicking the plus symbol to add an expression and then typing the name of your variable. If the variable is in scope then it should autocomplete.
For reference, here is the script in Studio being debugged in the screenshots:
let myClosureVariable = 5;
parent.on("pointerdown", (e) => {  // Runs when pointerdown occurs on the parent node  // The argument e contains useful info about this event:  // https://docs.zap.works/studio/scripting/reference/object/events/pointerdown/
  let myLocalVariable = myClosureVariable;
  debugger;
  parent.color([1,0,0,1]);});