Google Analytics
Integrating Google Analytics into a Zapworks Designer project supplements and enhances the data gathered from Zapworks Analytics. Monitoring web traffic using Google Analytics can help to measure progress against business goals such as m-commerce sales, brand engagement (dwell time), lead generation and social shares.
For an introduction to Google Analytics, please take a look at the Set up Analytics for a website and/or app article by Google.
Adding Google Analytics to Designer projects
Section titled “Adding Google Analytics to Designer projects”To set up analytics for your Zapworks Designer project, you must have a tracking ID. Please see the guide below to learn how to find your project’s tracking ID.
Adding your project to Google Analytics: Step-by-step
Section titled “Adding your project to Google Analytics: Step-by-step”The following section describes how you can add your project to Google Analytics and find your tracking ID.
- Go to Google Analytics and sign in.
- Create a new account if you do not have one prepared. To create a new account, click on the cog icon in the bottom left of the screen to open the Admin panel and then click on Create account. Follow the instructions provided by Google to create your new analytics account.
- If you are not already in the Admin panel, be sure to do so by clicking on the cog icon to the bottom left of the screen. Then, click on Create property and follow the instructions provided by Google.
- When you have created your new property, make sure that it is selected and then click on Data Streams. Create a new Web platform data stream.
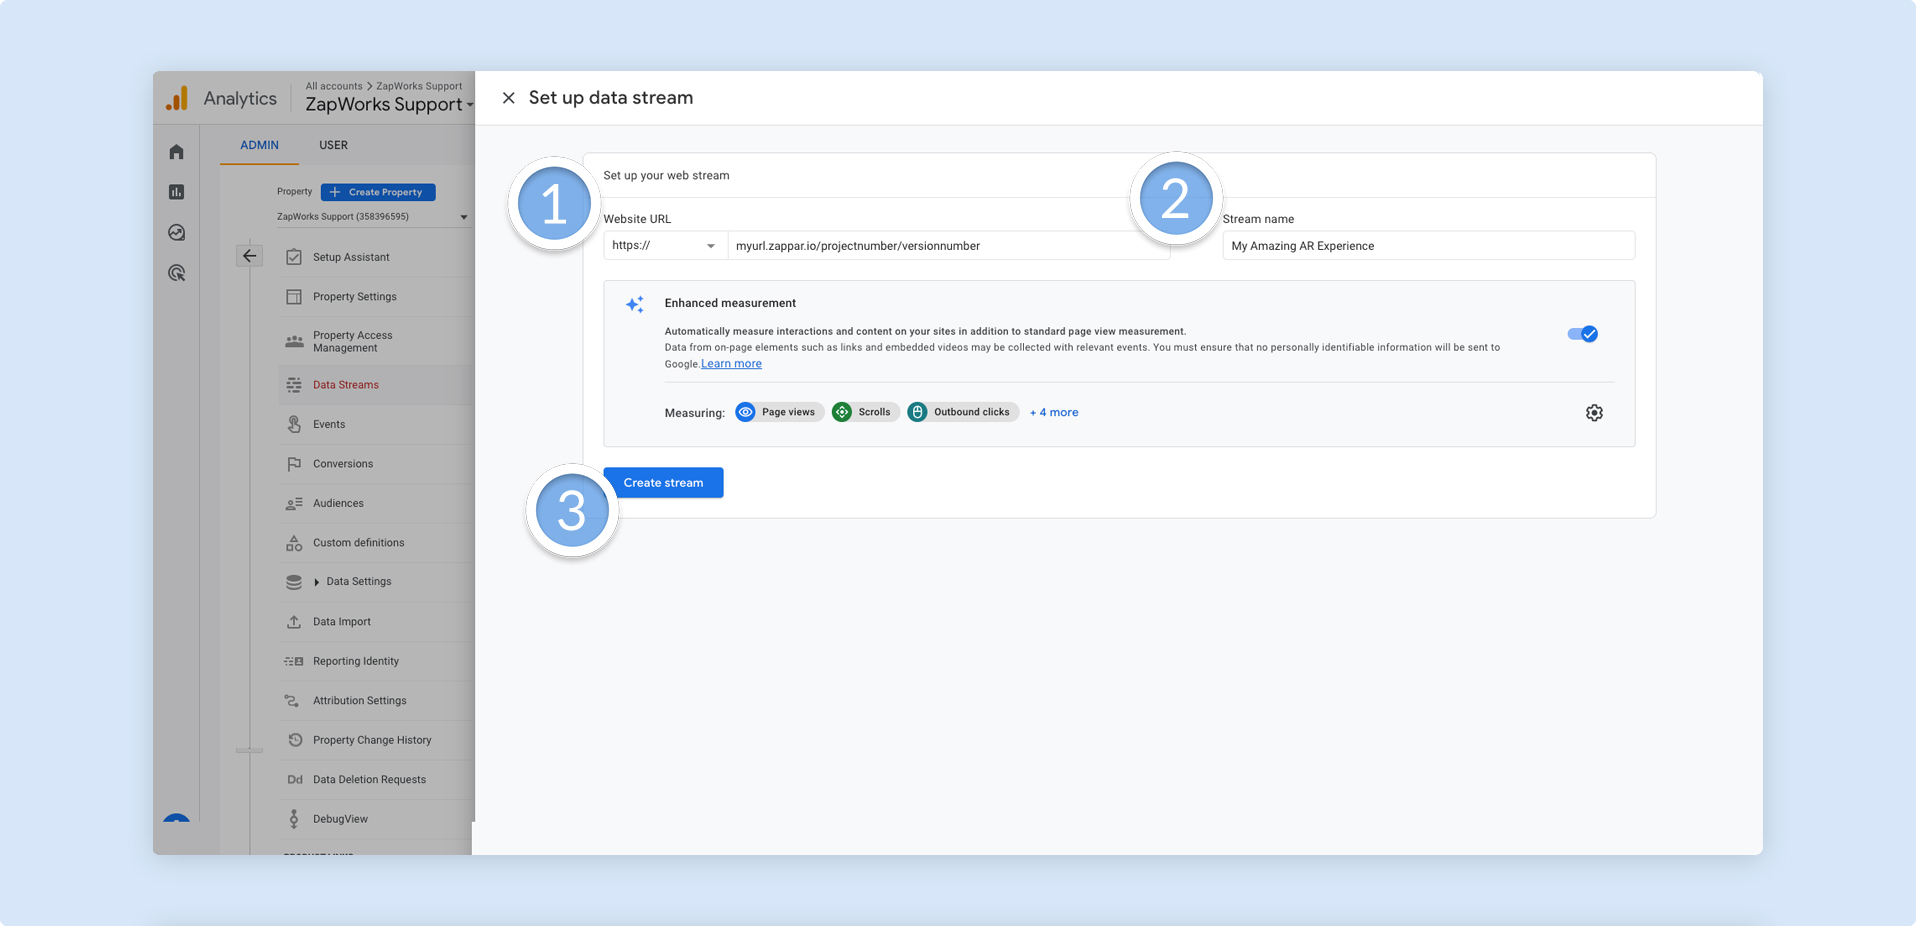
- Add the Website URL of your project and give it a Stream name. When you are done, click on Create stream.
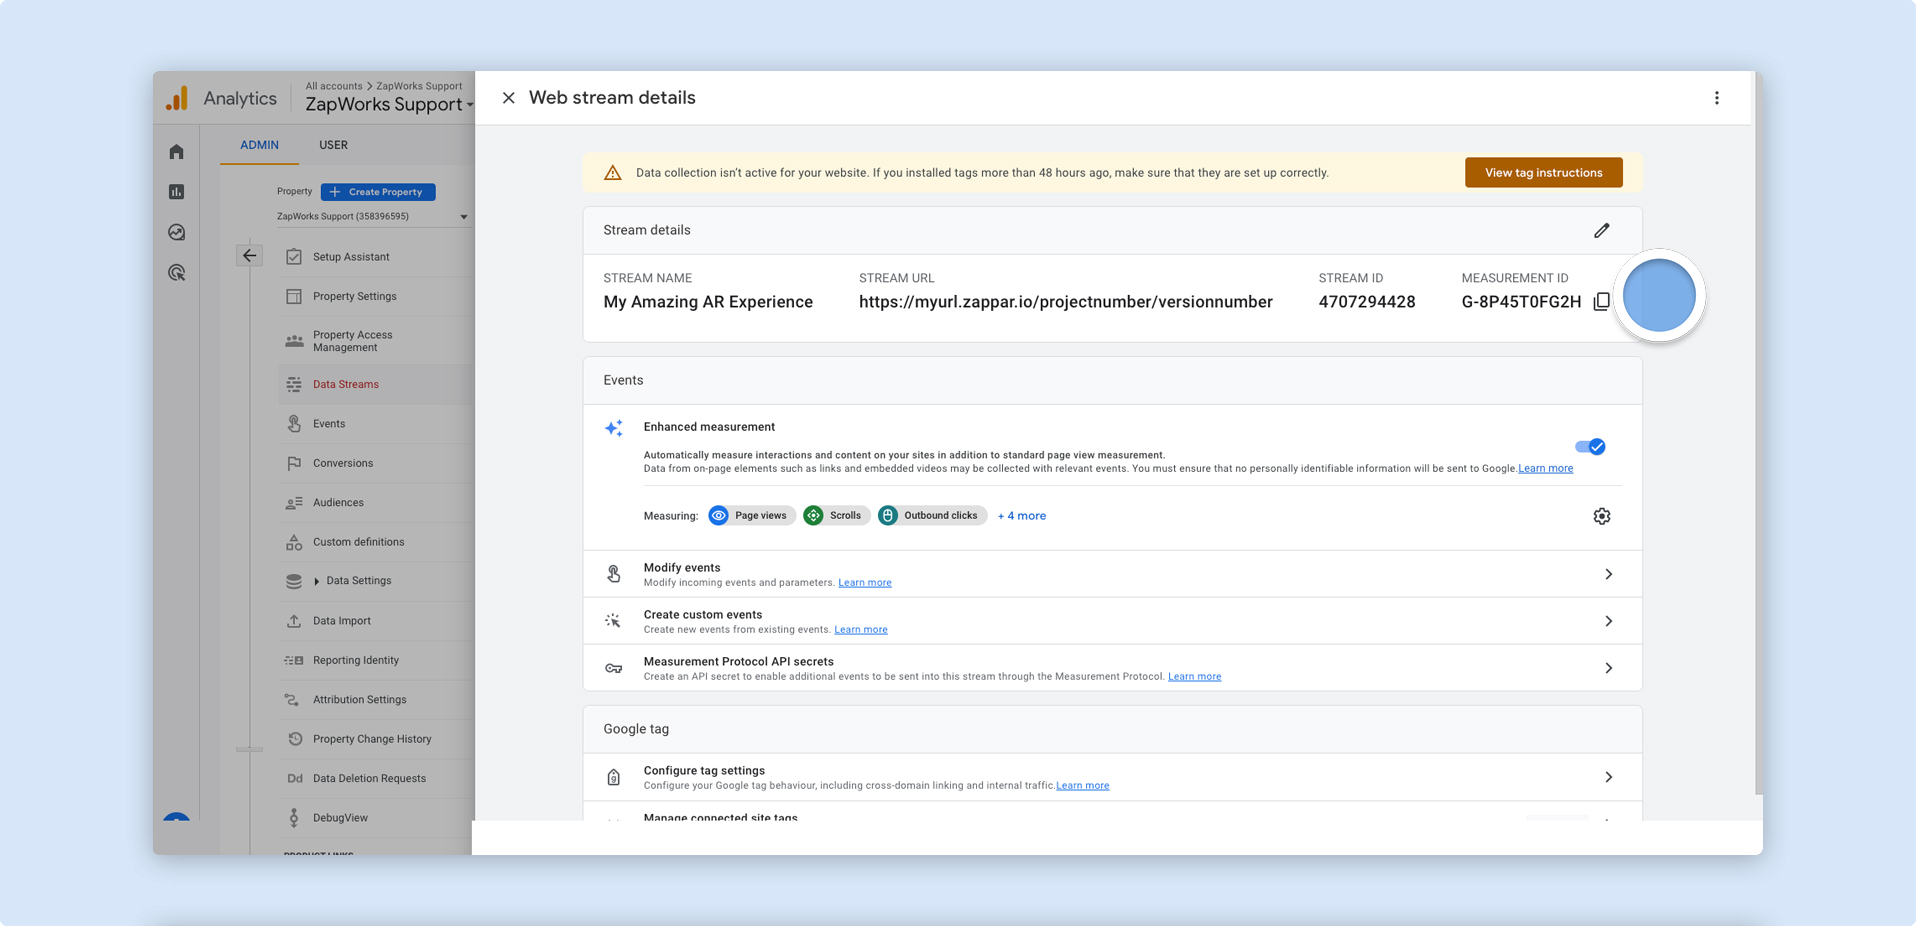
- Find your data stream’s Measurement ID. This is the tracking ID intended for use in Zapworks Designer.
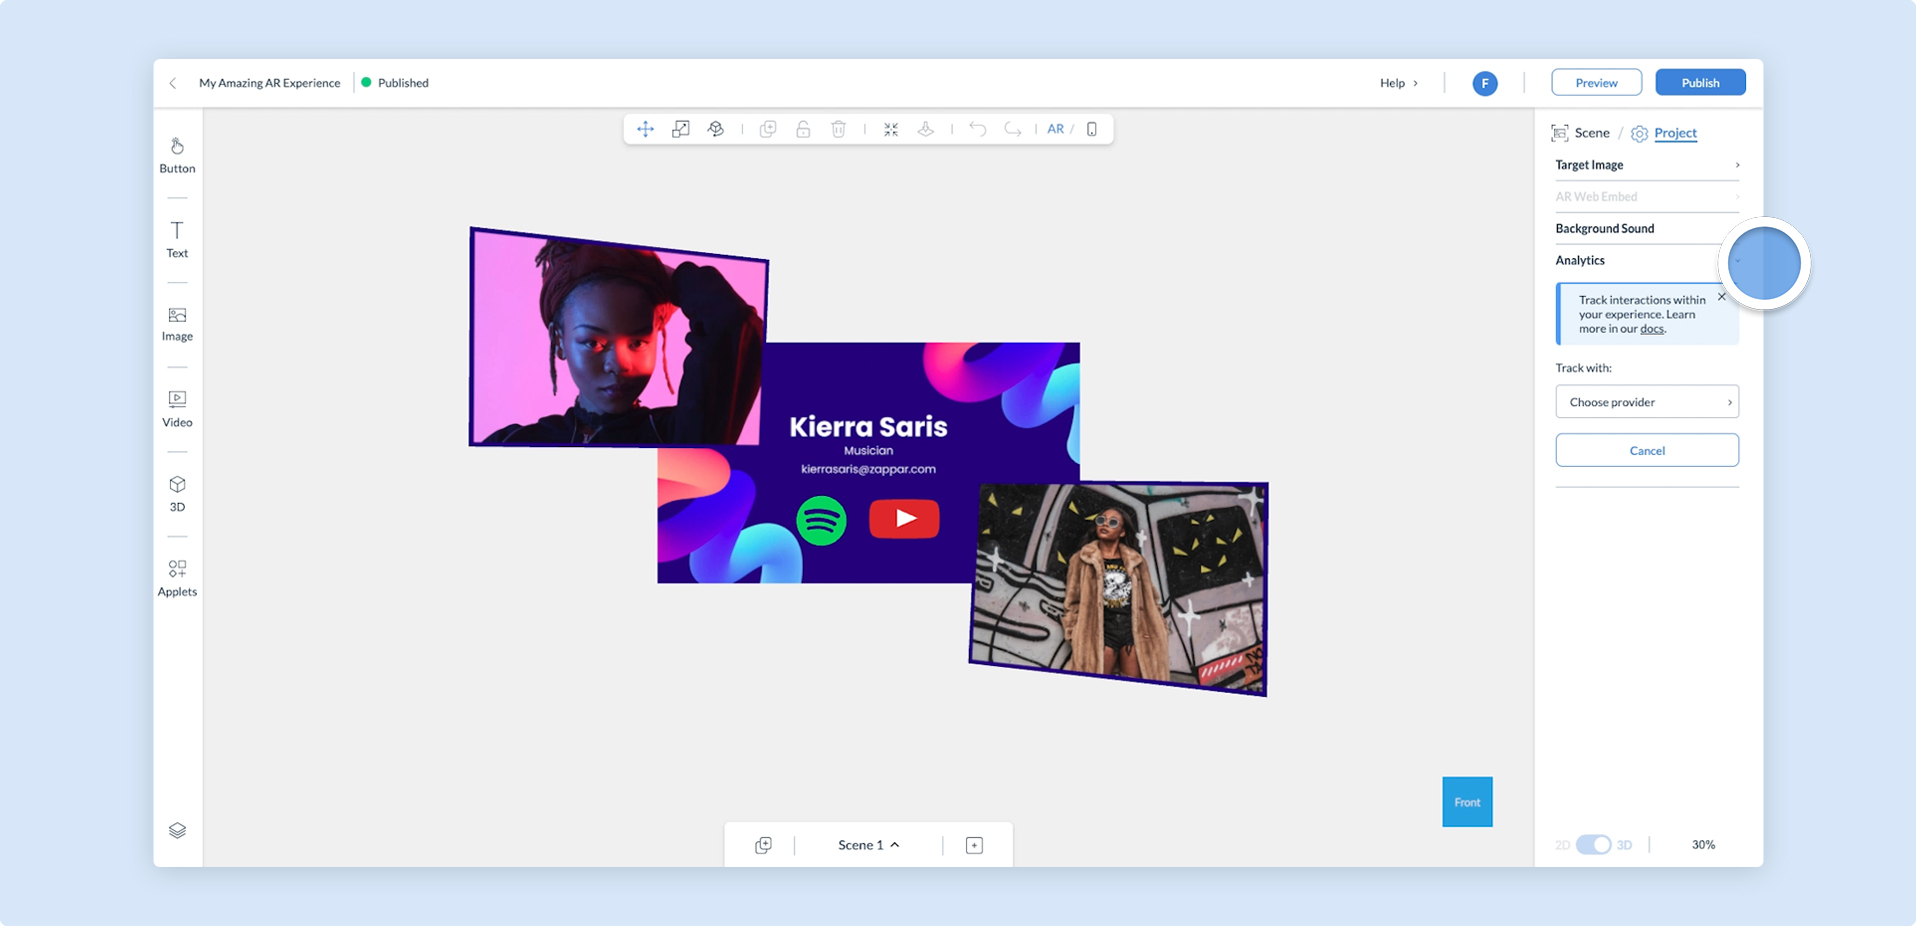
- Once you have copied your Measurement ID, go to https://my.zap.works and open up your project in Zapworks Designer. Find the Project Properties panel, to the right of the canvas.
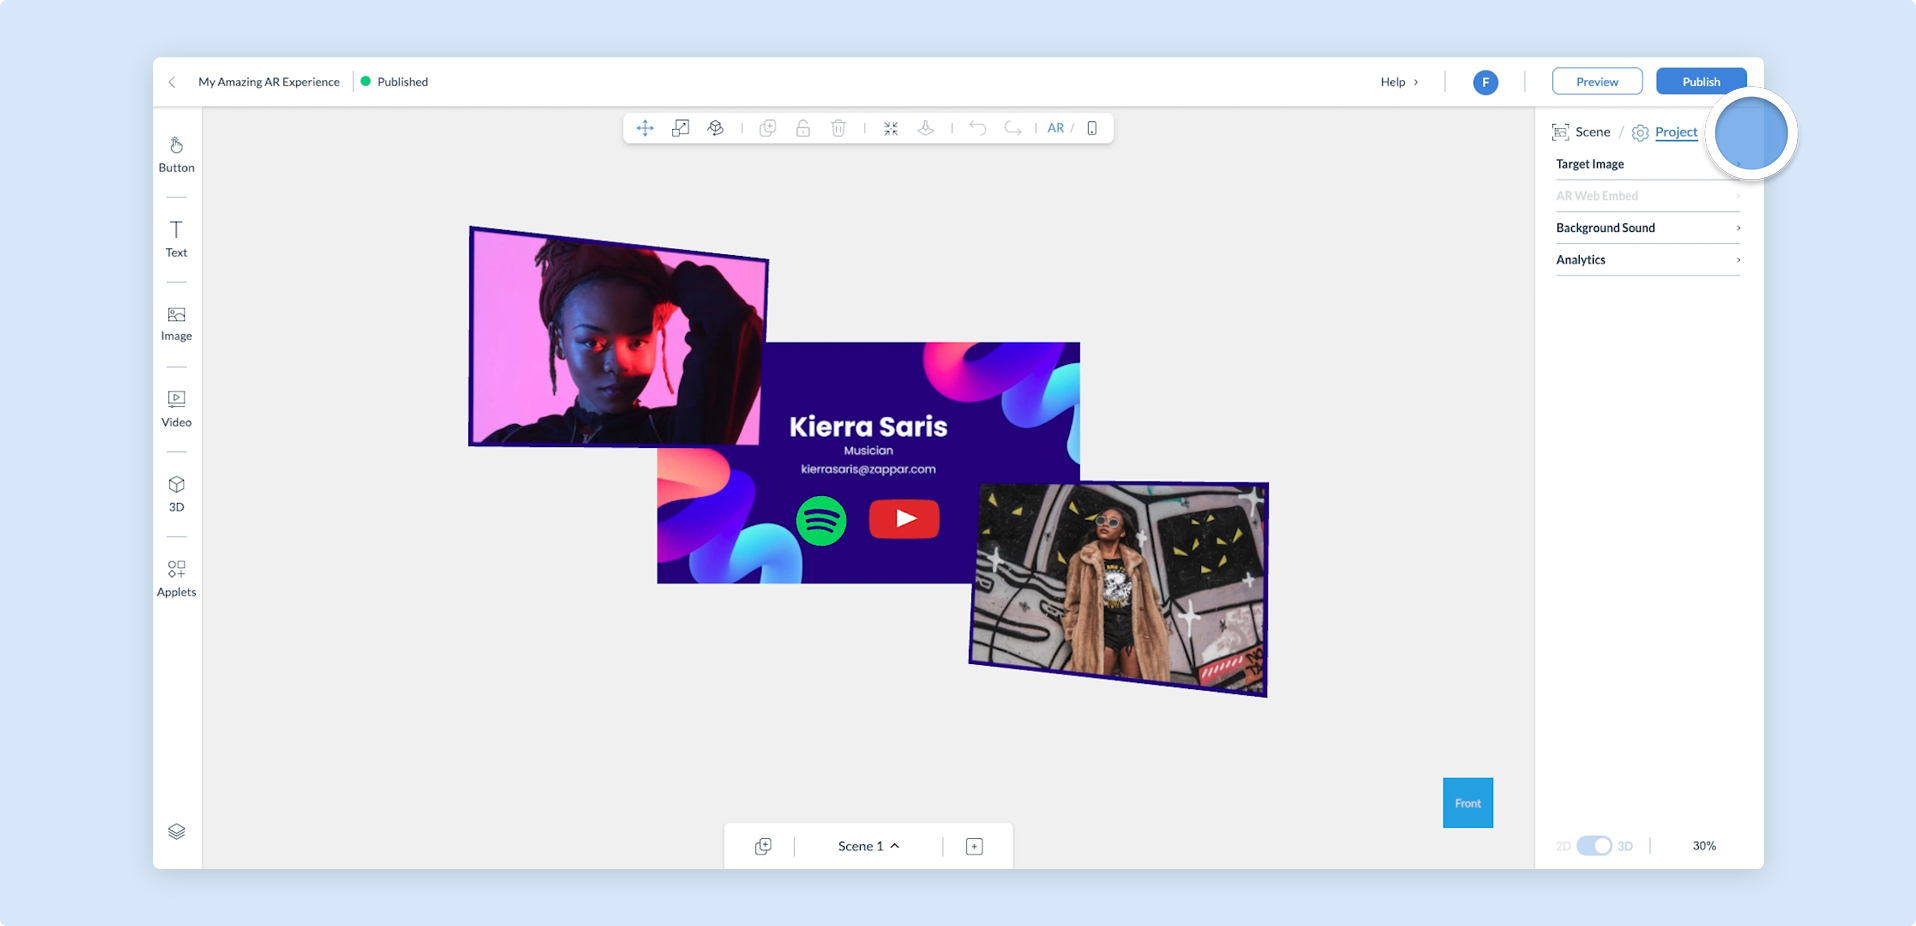
- Click on the Analytics menu option.
- Click on the Choose provider drop-down and select Google Analytics.
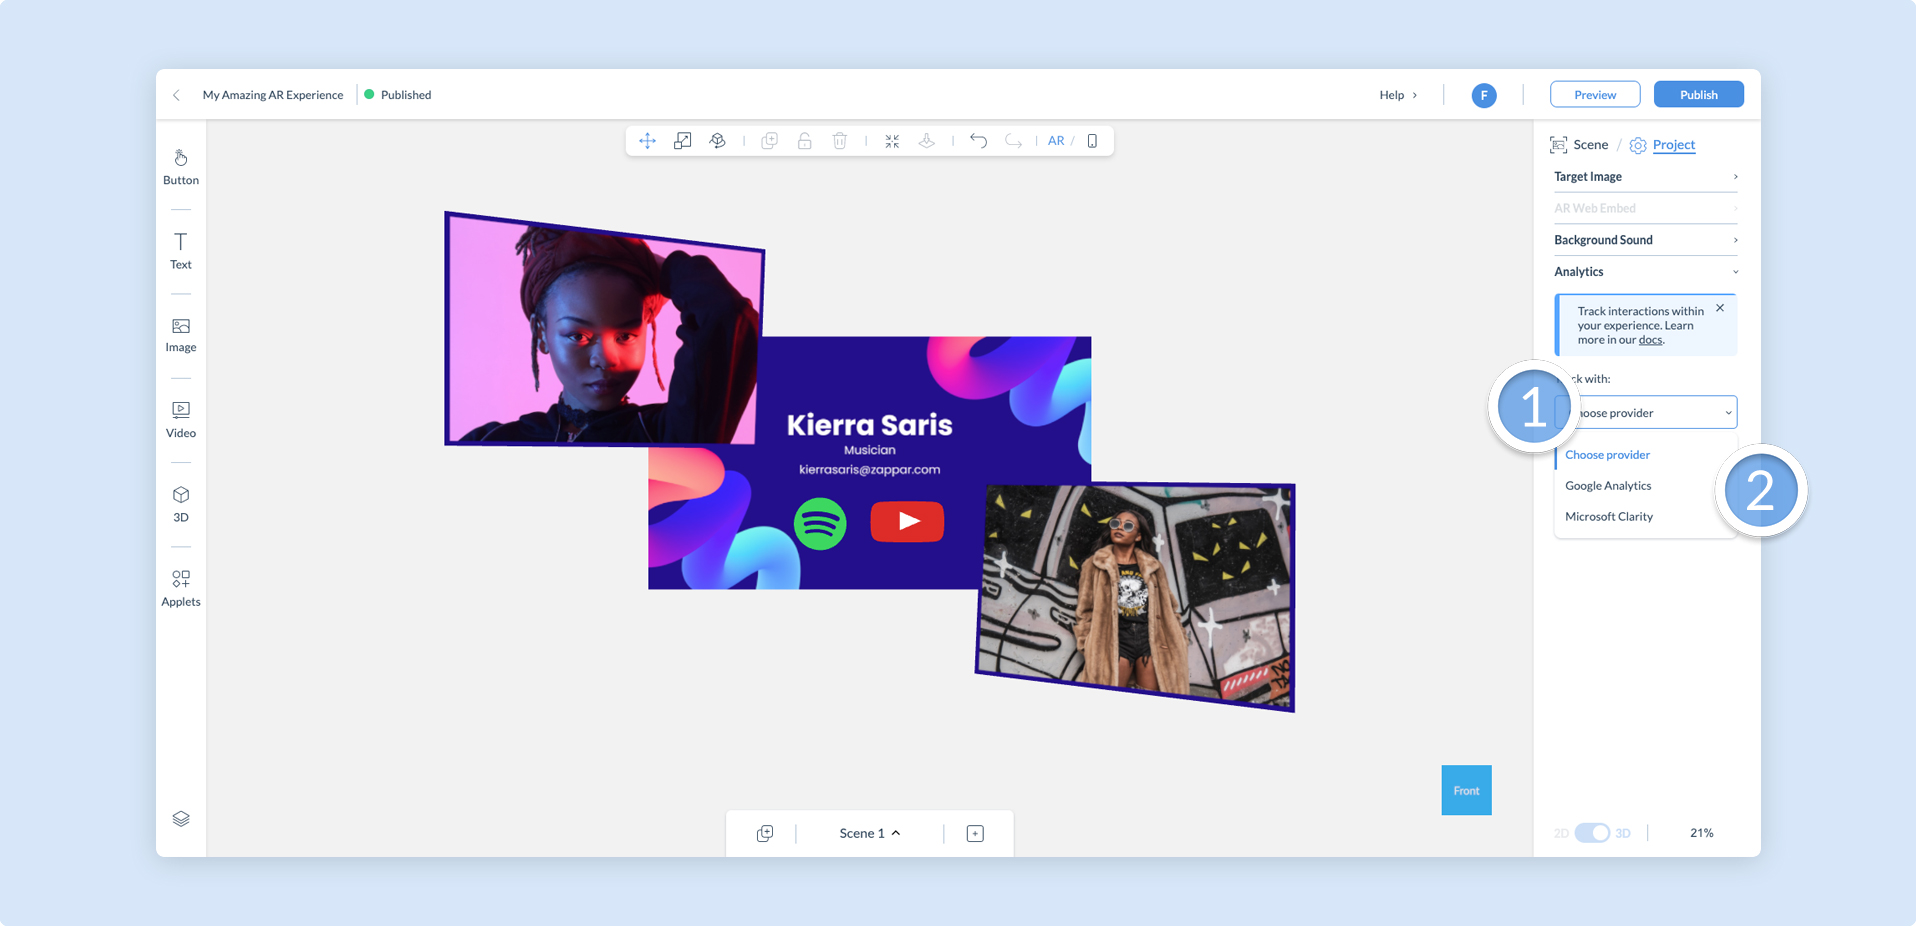
- Enter your data stream’s Measurement ID into the tracking ID input box, and click Save.
![]()
You may add more than one analytics provider to your project.
- Click on Publish in the top right of the navigation to publish your project and start sending analytics to your Google Analytics dashboard.
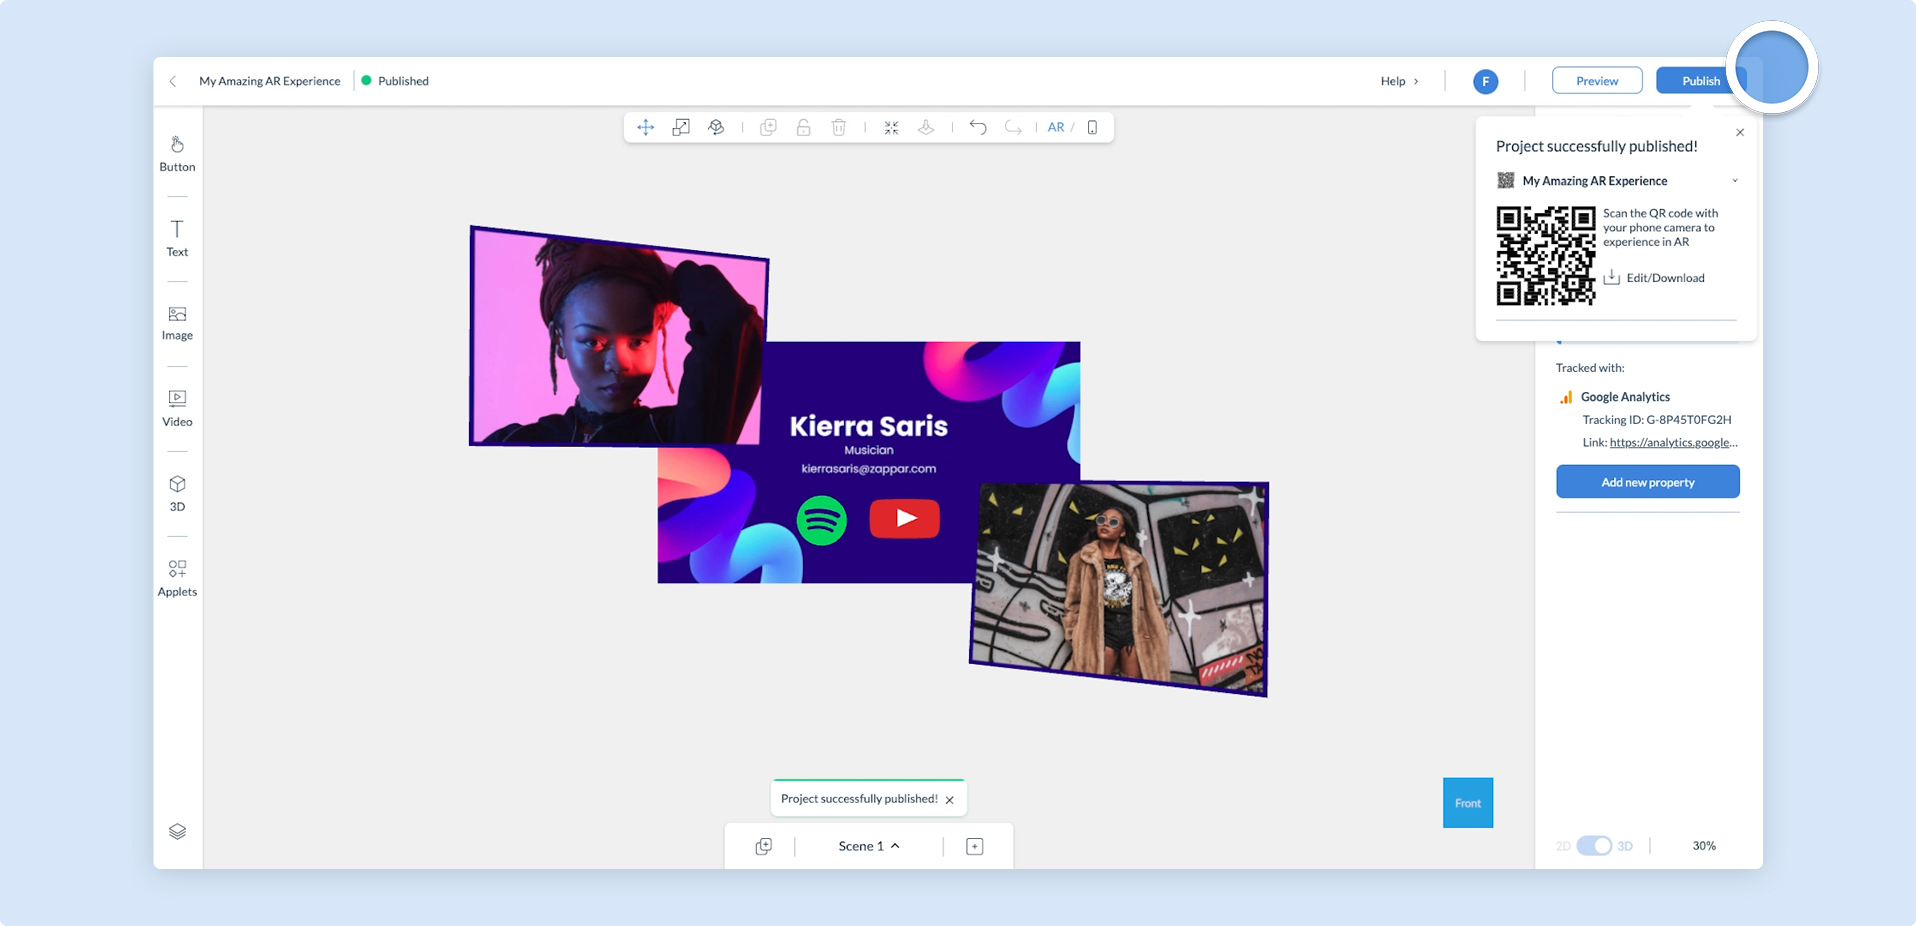
Analytics will not be logged when you preview your experience. To start logging data, your project must first be published.
Adding custom events to Google Analytics
Section titled “Adding custom events to Google Analytics”Zapworks Designer will automatically log actions taken by a user, such as when a video is played or an external link is followed. Google Analytics does not show these events by default, so you must add them as custom events manually.
It can take up to 24 hours for Google to show project analytics or allow the creation of custom event tags.
- Click on the cog icon in the bottom left of the screen to open the Admin panel and find the Custom definitions panel on your chosen property.
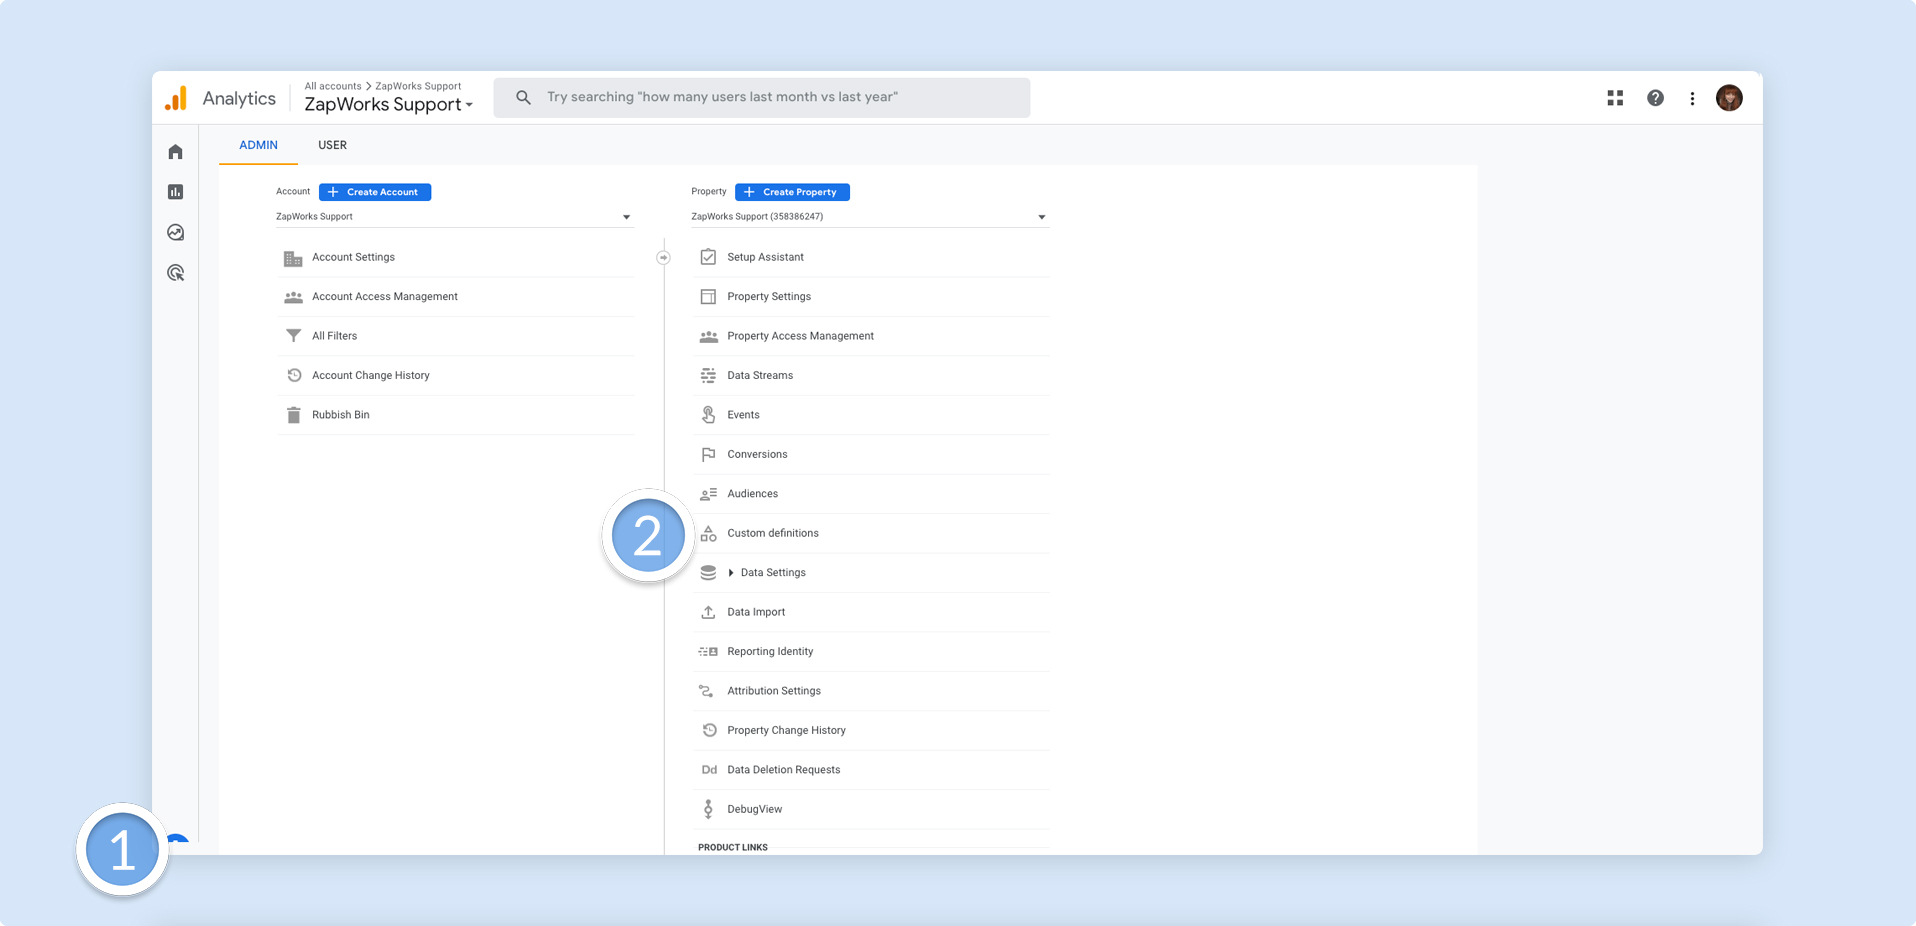
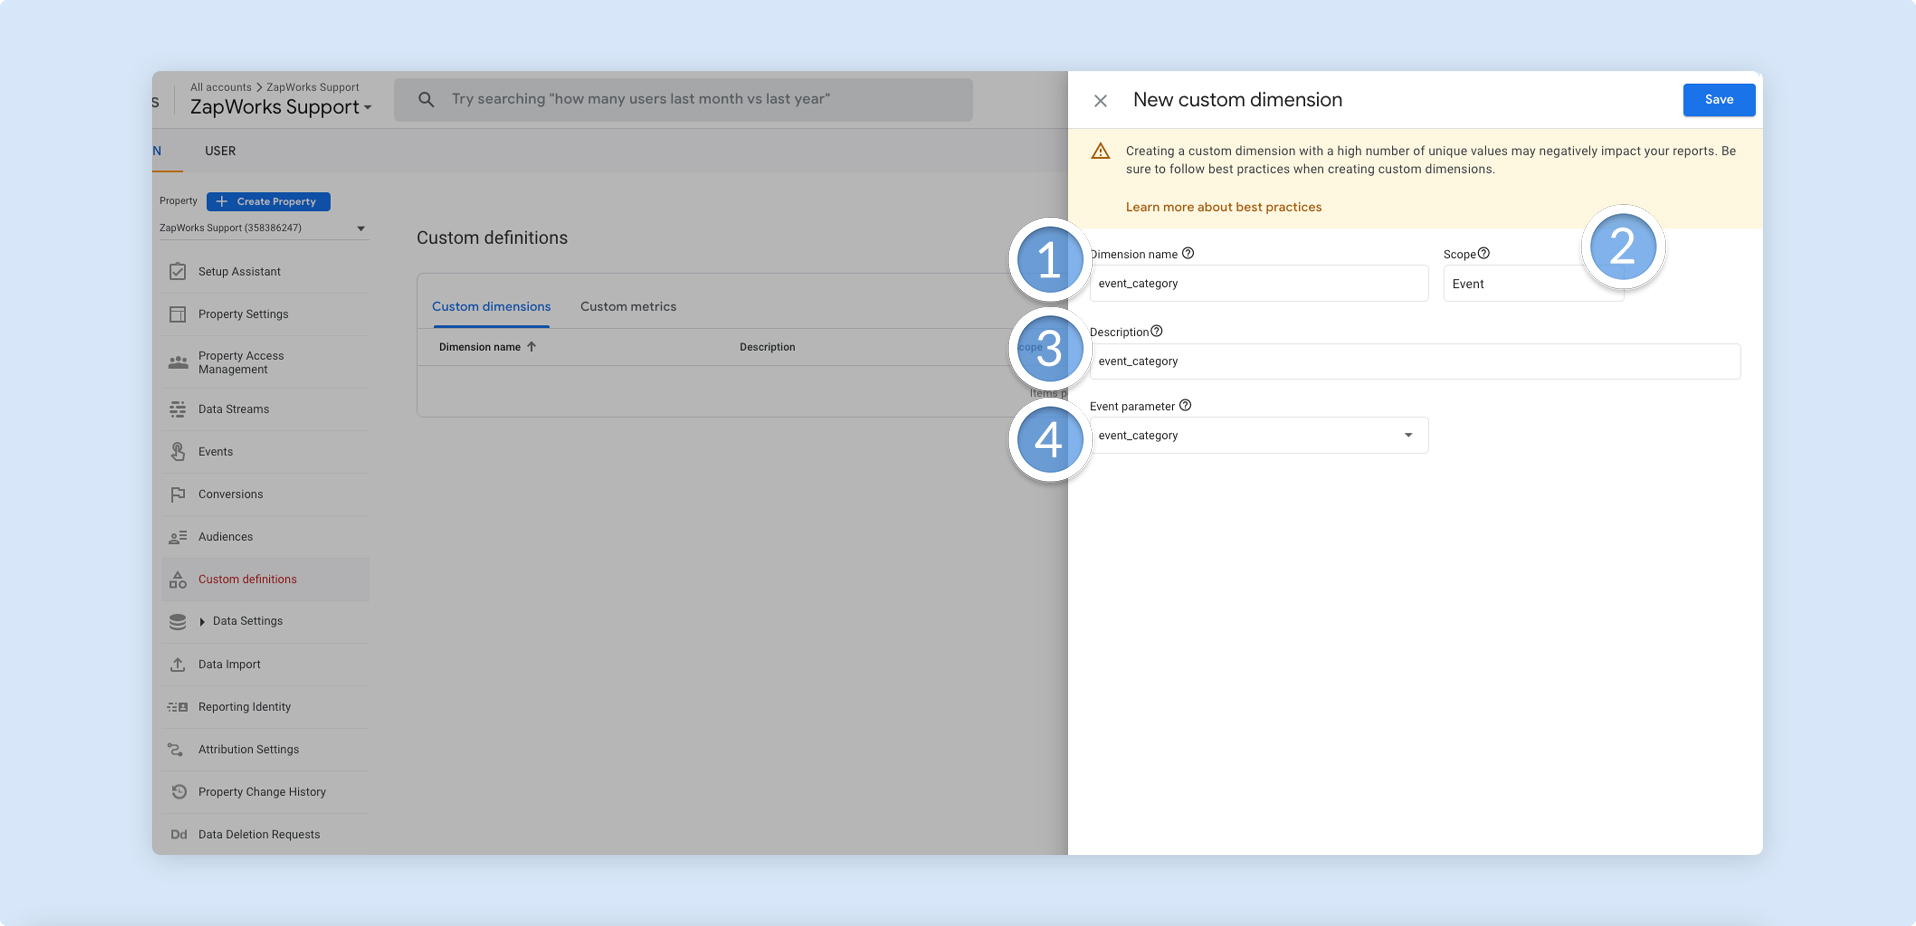
- Click on Create custom dimensions. Enter the following information:
- In the Dimension name input field, type
event_category. - The Scope should be left as
Eventby default. - In the Description input field, type
event_category. - In the Event parameter input field, type
event_category.
When you are done, click on Save.
- When you have saved your first custom dimension, click on Create custom dimensions again. Enter the following information:
- In the Dimension name input field, type
event_label. - The Scope should be left as
Eventby default. - In the Description input field, type
event_label. - In the Event parameter input field, type
event_label.
When you are done, click on Save.

- Once your custom definitions have been saved, you may view them by first clicking on Reports in the left navigation menu, then selecting Engagements. You can then select the Events tab to monitor your custom events.
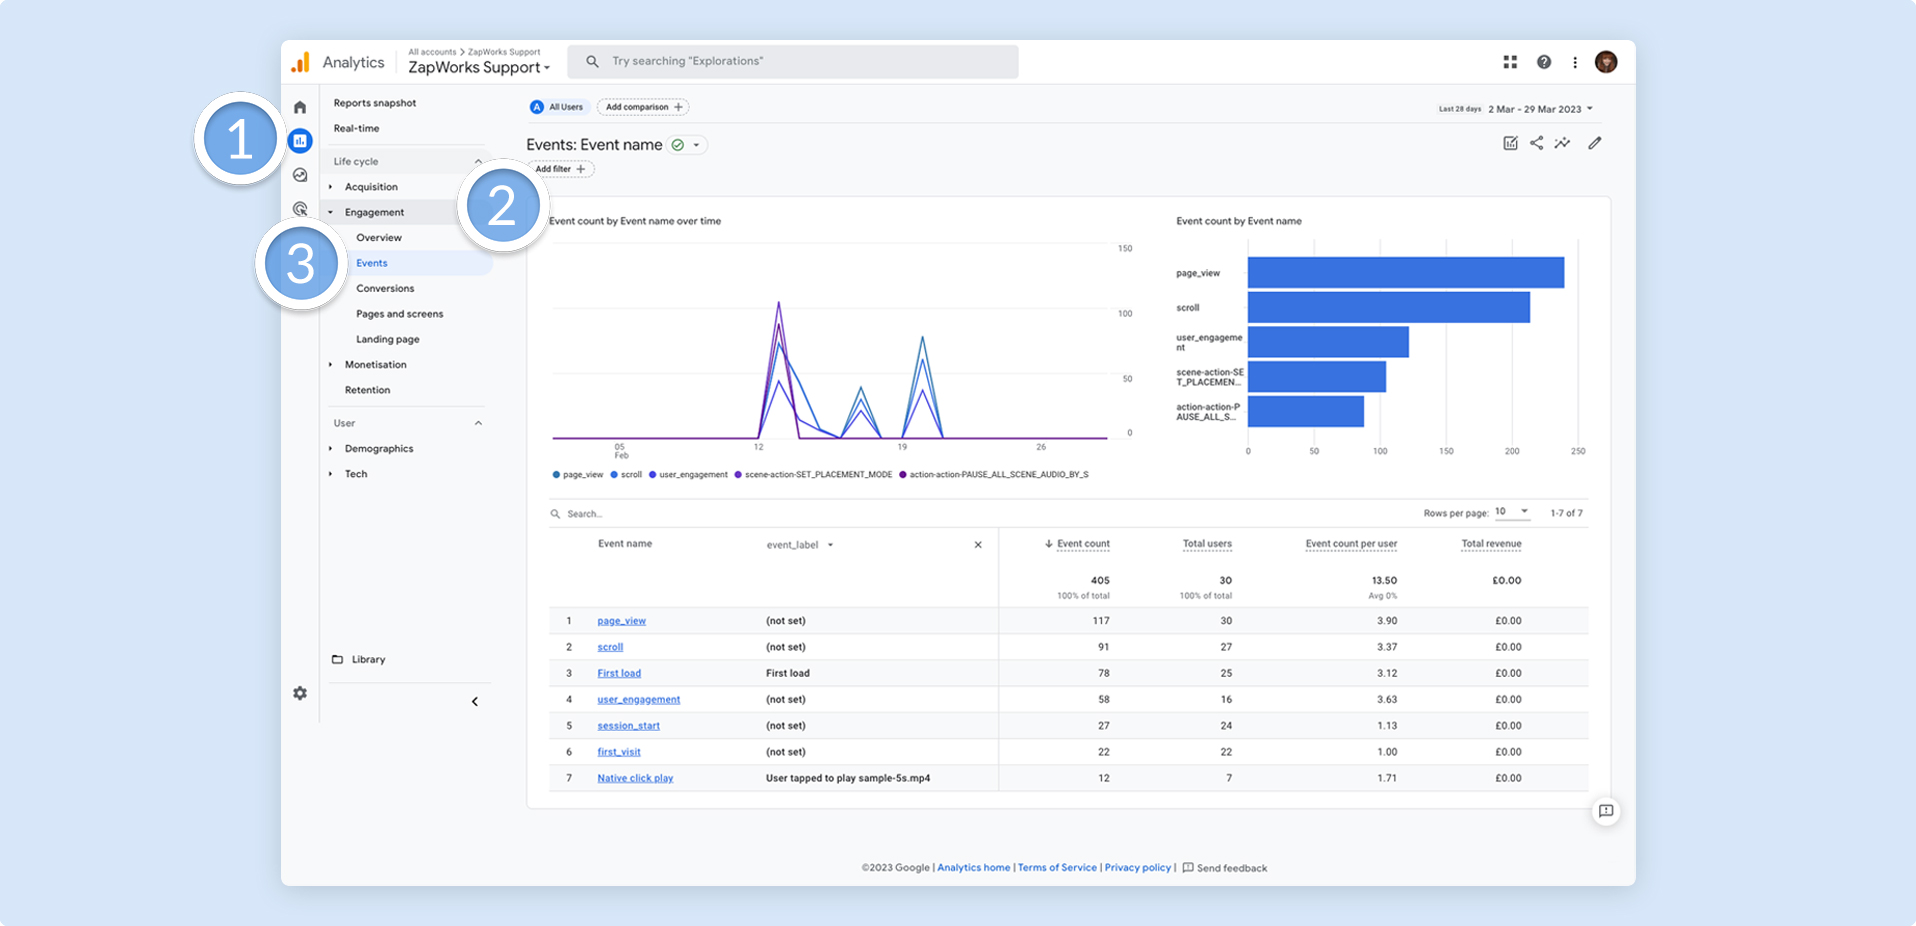
Most events are automatically logged by Designer. See the table below for some common interactions that users may have with your experience.
| Event | Description |
|---|---|
| Link social | Shows when a user has tapped on a particular component to launch a social platform. |
| Link page | Shows when a user has tapped on a particular component to launch an external website. |
| Link scene | Shows when a user has tapped on a particular component to go to another scene. |
| Scene view | Shows when a user has viewed a particular scene. |
| Play video | Shows when a user has tapped on a particular component to play a video. |
| Animate model | Shows when a user has tapped on a particular component to animate a 3D model. |
| Dial number | Shows when a user has tapped on a particular component to dial a phone number. |
| Compose email | Shows when a user has tapped on a particular component to compose an email. |
| Save contact | Shows when a user has tapped on a particular component to save a contact. |
| Play sound | Shows when a user has tapped on a particular component to play an audio file. |
| Enlarge Image | Shows when a user has tapped on a particular component to enlarge an image. |
If you have access to the AR Web Embed trigger, you will see exclusive events for your AR Web Embedded content.