Analytics in ZapWorks
ZapWorks is supported by a stats dashboard (called Analytics) that provides aggregated data in near real-time. That data can be segmented into all projects, a group of projects or individual projects.
Dashboard
Section titled “Dashboard”The below data points are viewable in the dashboard:
- Time spent in an AR experience;

Dwell time is logged once the experience or app is closed. Experiences launched into the device web browser (WebAR) won’t log accurate dwell time as we can’t always determine whether a tab fully closes or remains open in the background. We recommend using third-party analytics when logging this type of data for WebAR experiences, see more information here: Google Analytics for WebAR.
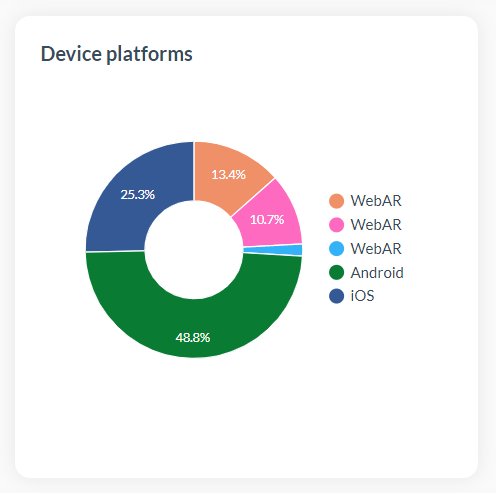
- Device platform type (iOS, Android, WebAR) used to launch an AR experience;
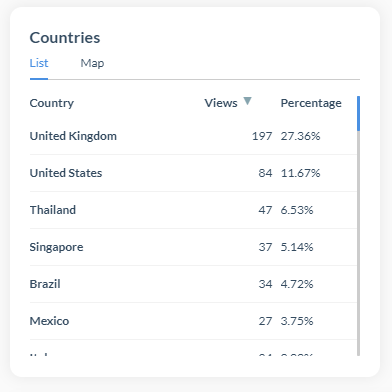
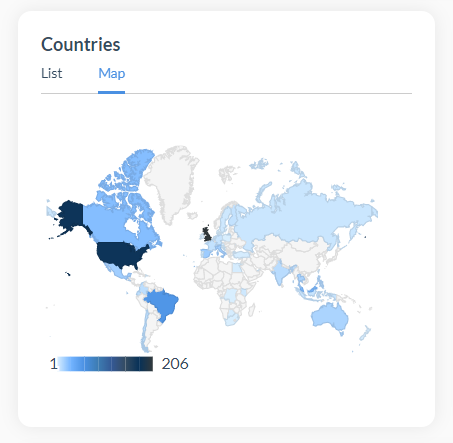
- The geographic region where an AR experience was launched (table or map);
- Number of views per day or per month over a certain period of time;

- Number of views at a certain time of the day;

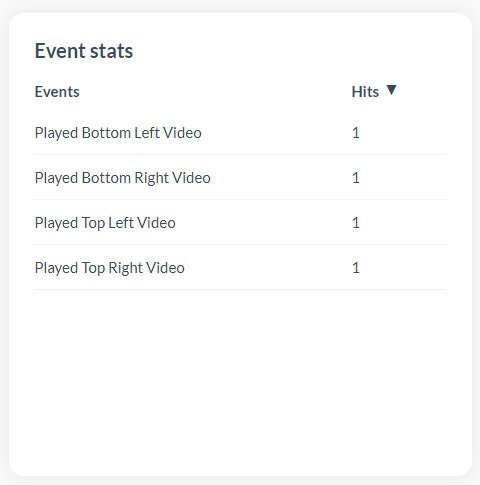
- Events in an AR experience (did a user play a game, take a photo, watch a video, enter a competition etc.)
Analytics can be customized on a campaign-by-campaign basis, and are available both through the web interface and downloadable as a CSV file for import into Excel or other tools.
Views related to campaigns where there might be multiple targets or locations across different countries can also be grouped or viewed individually if required.
##Accessing Analytics
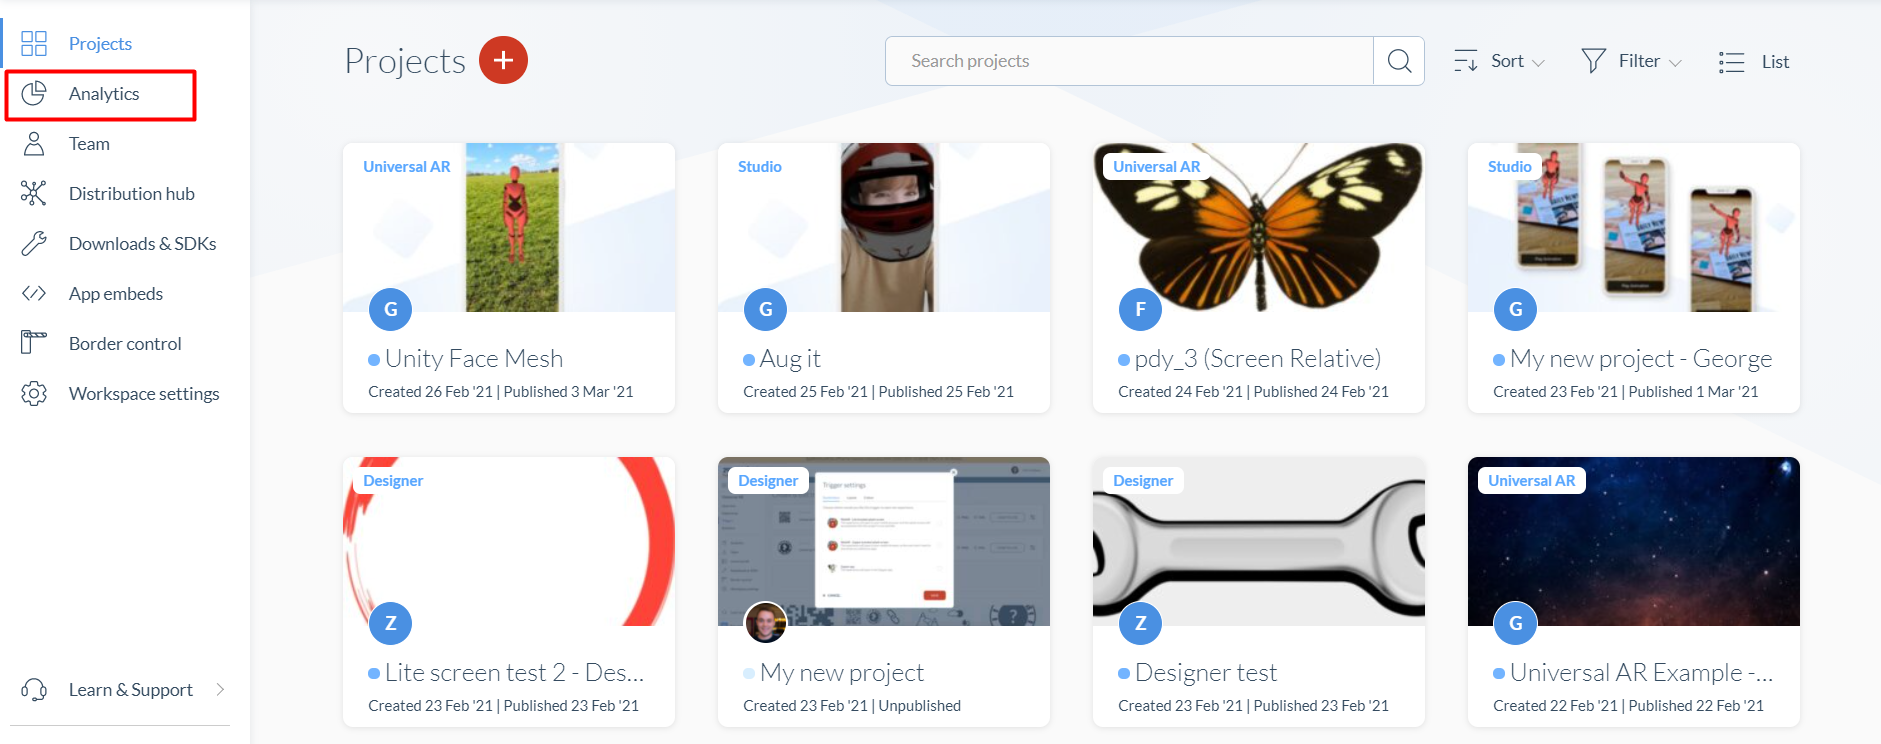
Analytics can be accessed from your workspace by clicking the Analytics tab in the left hand navigation.
By default, you’ll see the data for all the projects in your workspace.
To see the analytics for a specific group of projects, use the drop down button next to ‘All projects’ and select a group:

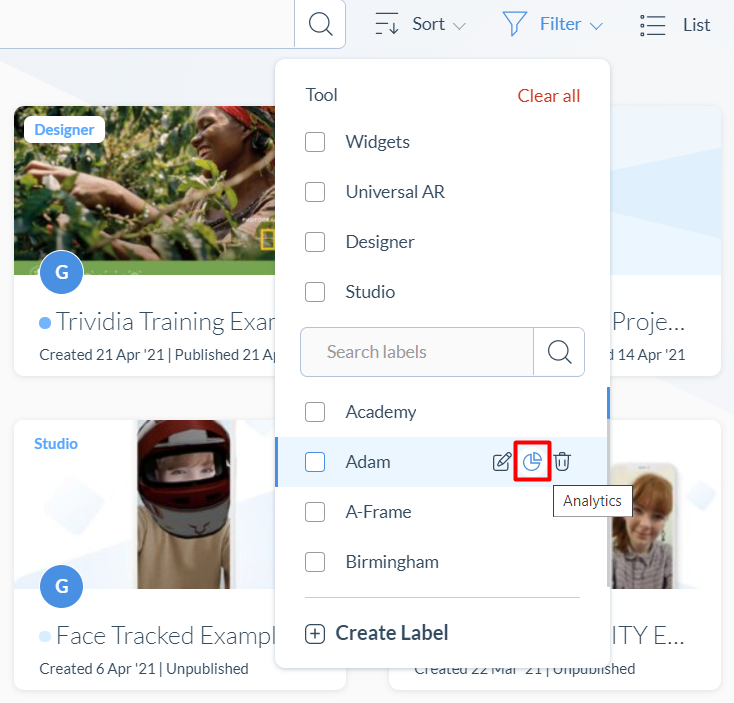
Alternatively, you can access a group’s analytics from the projects overview page by first clicking on the ‘Filter’ drop down button, click on the analytics icon next to the group in question.
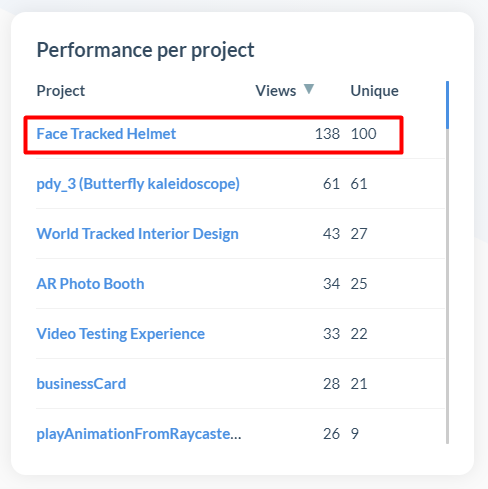
To see the analytics for an individual project, click on the name of the project in the box with all the projects, on the right of the screen:
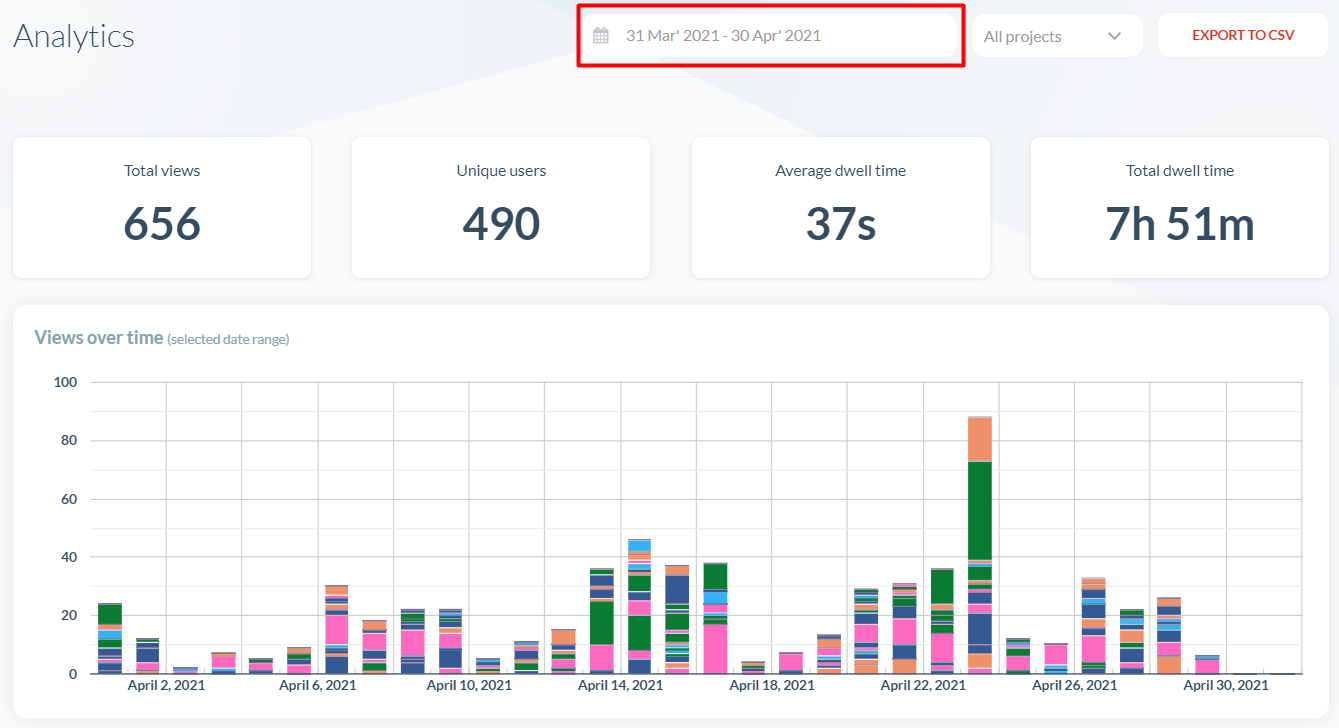
Each bar in the graph represents a single day within the date range selected.
What does ‘Total Views’ mean?
This is the total number of views for the project or group of projects that have been selected.
What are ‘Unique Users’?
This is the number of unique devices that have launched a project.
What are ‘Average Dwell Time’ and ‘Total Dwell Time’? What’s the difference and how are the numbers calculated?
Average dwell time is the average length of time users spend in the experience from when it has loaded. The total dwell time is the cumulative time spent by all users interacting with your AR content. Note that dwell time is not recorded for WebAR views.
What is included in the ‘Others’ group within my Analytics data?
The data within the Analytics dashboard lists the top fifty projects by the number of scans. All other projects are aggregated into a single group, ‘Others’. For a complete breakdown of the analytics data please use the ‘Export to CSV’ option in your Analytics dashboard.
Is it possible to see the regions more granularly than just by country (i.e. states, counties, cities)?
Not through the standard Analytics tool. There are potentially some custom solutions for this which you can contact us to discuss.
How do you make sure the events you want to track are shown in Analytics?
By launching your AR experience, interacting with different elements and then checking on Analytics.
Now that I have this data, what can I do with it to improve my experiences?
Are the key features being interacted with? If not then consider the UI/UX to further emphasise these. Is average dwell time low (under 60 seconds)? Consider enhancing the experience with more content for your users.