Debugging your project
Debugging is a crucial part of the development process, and Mattercraft offers powerful and flexible debugging tools to help you identify and resolve issues efficiently.
Whether you need to troubleshoot live preview logs, analyze download sizes, or address specific problems, Mattercraft's debugging capabilities have got you covered.
Accessing debugging features
To access the debugging features in Mattercraft, look for the debug panel located in the bottom right corner of the interface:
You can use the following tabs to debug your project:
| Status Bar tab | Description |
|---|---|
| Live Preview Logs | View messages logged from a script and allows you to see what devices are currently experiencing the project via Live Preview. |
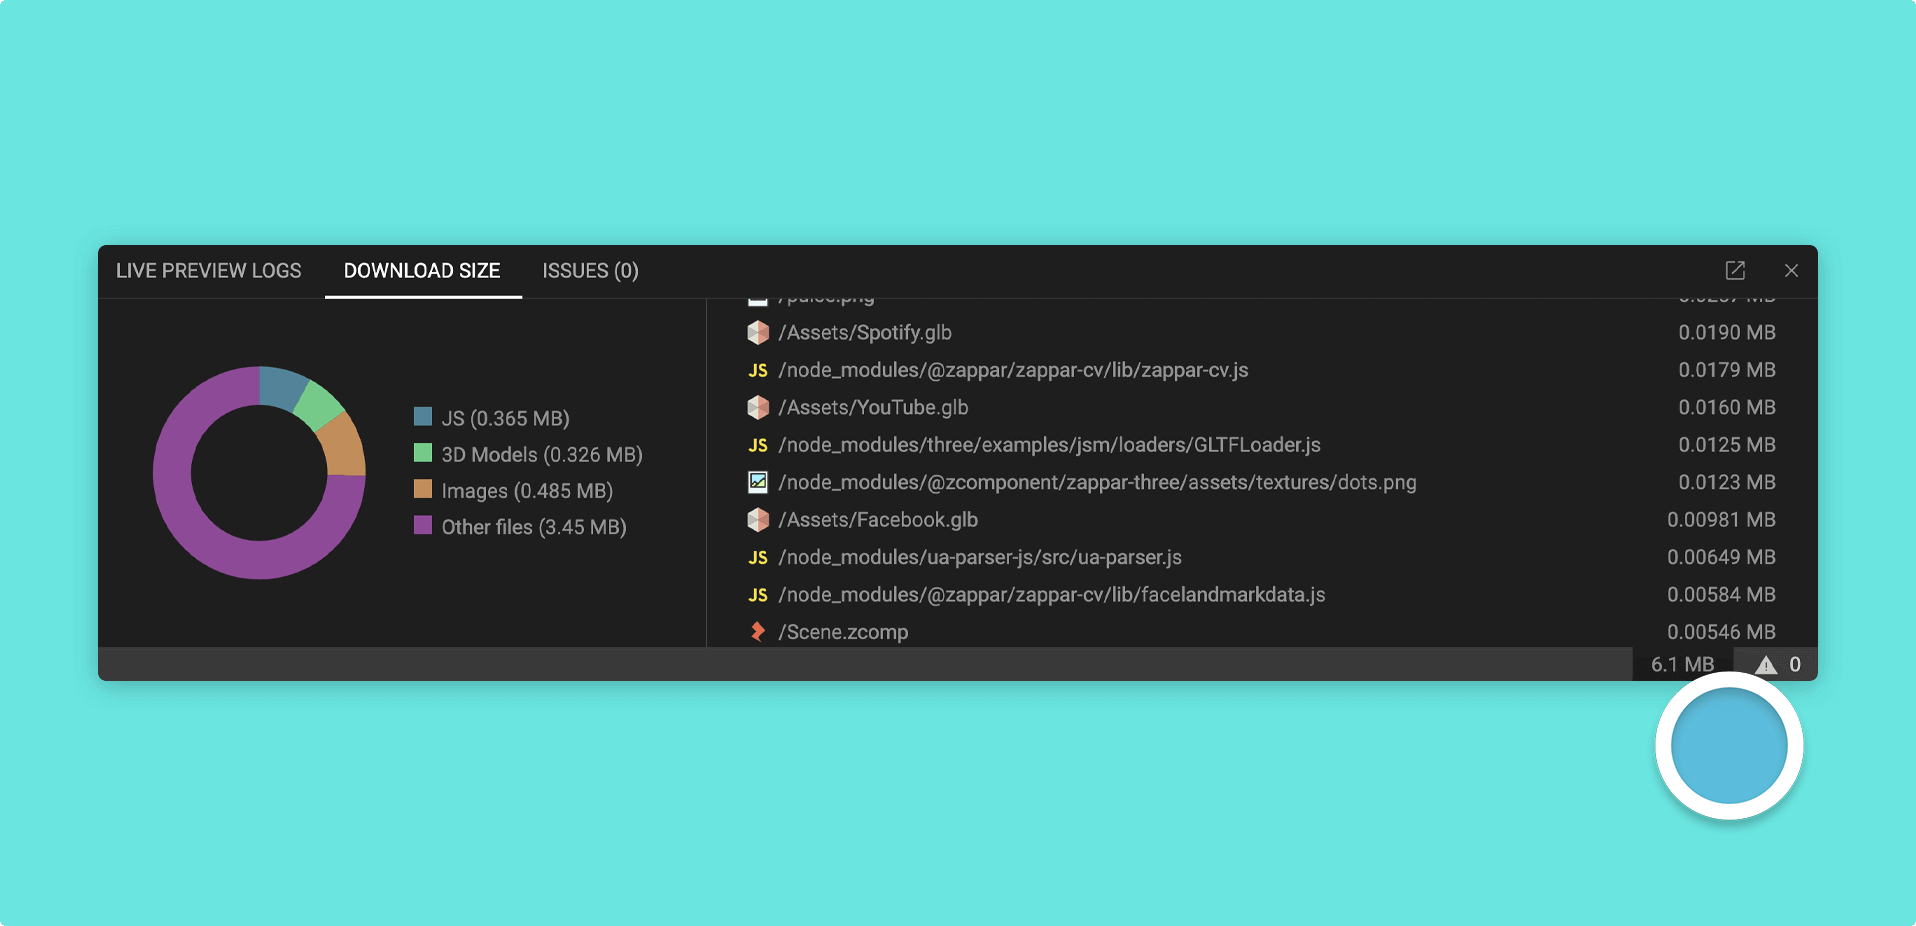
| Download Size | Analyzes your project for insights into how much data end users are likely to download when they access your experience. |
| Issues | Shows the amount of issues in your project, along with the name of those errors and where you can find the node that caused it. |
Console Logs
Console logs are an essential tool for debugging, as they allow you to output messages to the web console. In Mattercraft, there are two ways to use console logs:
Console Log Action
Mattercraft provides a Behavior Action for creating console logs effortlessly.
To add a console log action to your Mattercraft project:
- Find the Node you wish to activate the Console Log Action with inside the Hierarchy Panel and select it
- Head to the Behaviors Panel and click on the + (plus) icon
- Add a Console Log Action to your project
Script
You can also set up custom console logs in your scripts, as shown in the example below:
// Register that this node should be listening to an event,
// in this case onPointerDown (on click or tap)
this.register(this.instance.onPointerDown, evt => {

    // Send this message to the console log
    console.log("Button clicked!");

});
Utilizing existing debugging tools
As Mattercraft is designed for web-based deployments, you can also take advantage of existing debugging technologies like the Chrome Inspect tool for additional debugging capabilities and insights.